Сазнај да ли заистапобеђујеш.
Сваки prop који пратиш постаје верификовани запис резултата. Проценат погодака, ROI, добит/губитак, низови и сегментне анализе — да удвостручиш оно што ради и одсечеш оно што ти празни bankroll.


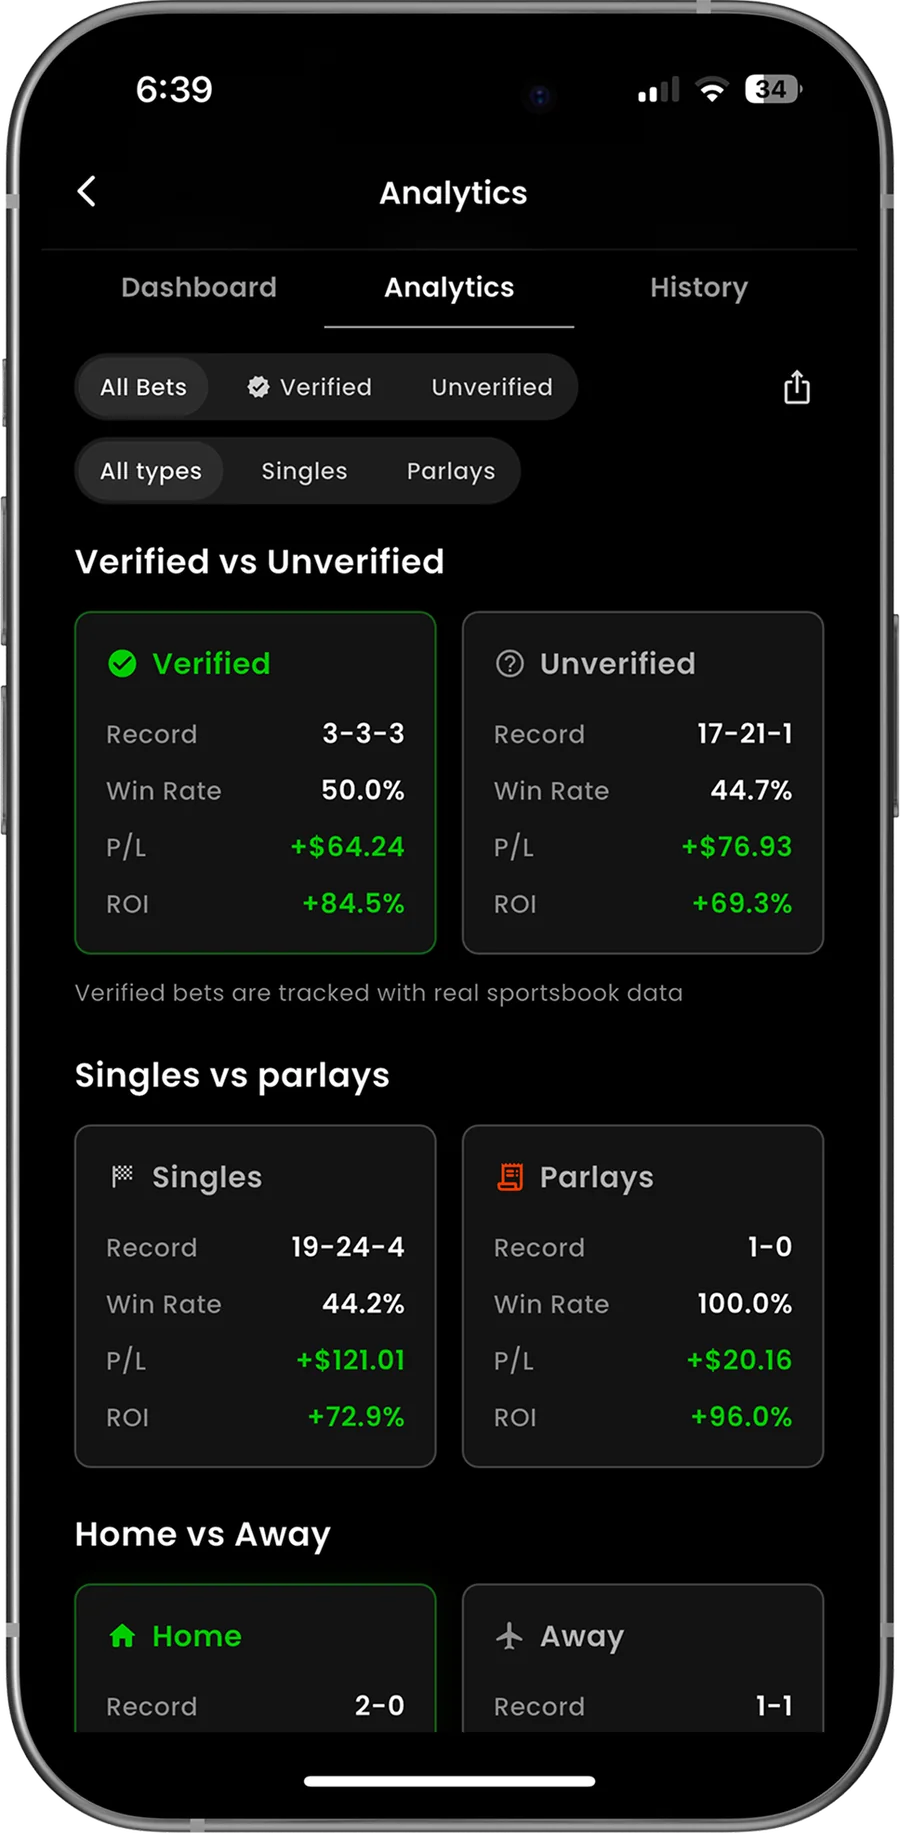
Зашто Аналитика
Све што озбиљном кладионичару треба да измери своју предност.
Пет ствари које пакет Аналитике ради, а које апликација за белешке и гомила screenshot-ова никад не би могле.
Верификовани запис
Окладе потврђене код кладионице се закључавају након почетка утакмице, па се твоје статистике не могу улепшати.
Стварни ROI по спорту
Види проценат погодака и добит у свакој лиги на коју се кладиш.
Сегментирај све
Режи по домаћин/гост, опсегу квота, кладионици, типу prop-а и величини улога.
Уочи низове и цурења
Кумулативни и месечни P/L тачно показује шта покреће — или празни — твој bankroll.
Пуна историја обрађених оклада
Свака оцењена оклада са исплатом, улогом и резултатом у једном скролујућем логу.
Контролна табла
Твоја предност, на први поглед.
Отвори апликацију и одмах види да ли си у плусу или минусу. Шест live KPI-јева, кумулативна P/L крива и месечне анализе — филтрирано по Све, 7, 28, 60 или 365 дана, и по верификованим vs неверификованим окладама.
Отворене vs обрађене на први поглед
Прекидач само-верификовано за запис којем можеш веровати
Добит у јединицама (u/ku) или у новцу
Patterns
Пронађи обрасце. Заустави цурења.
Иди иза укупног броја. Види тачно одакле ти долази добит — домаћин или гост, фаворит или аутсајдер, која кладионица, која лига — да се ослониш на своје победничке обрасце.
Сегментирај по спорту, типу prop-а и величини улога
Проценат погодака по кладионици
Предност на фаворитима vs аутсајдерима
Зеленом истиче твој најпрофитабилнији угао
Историја
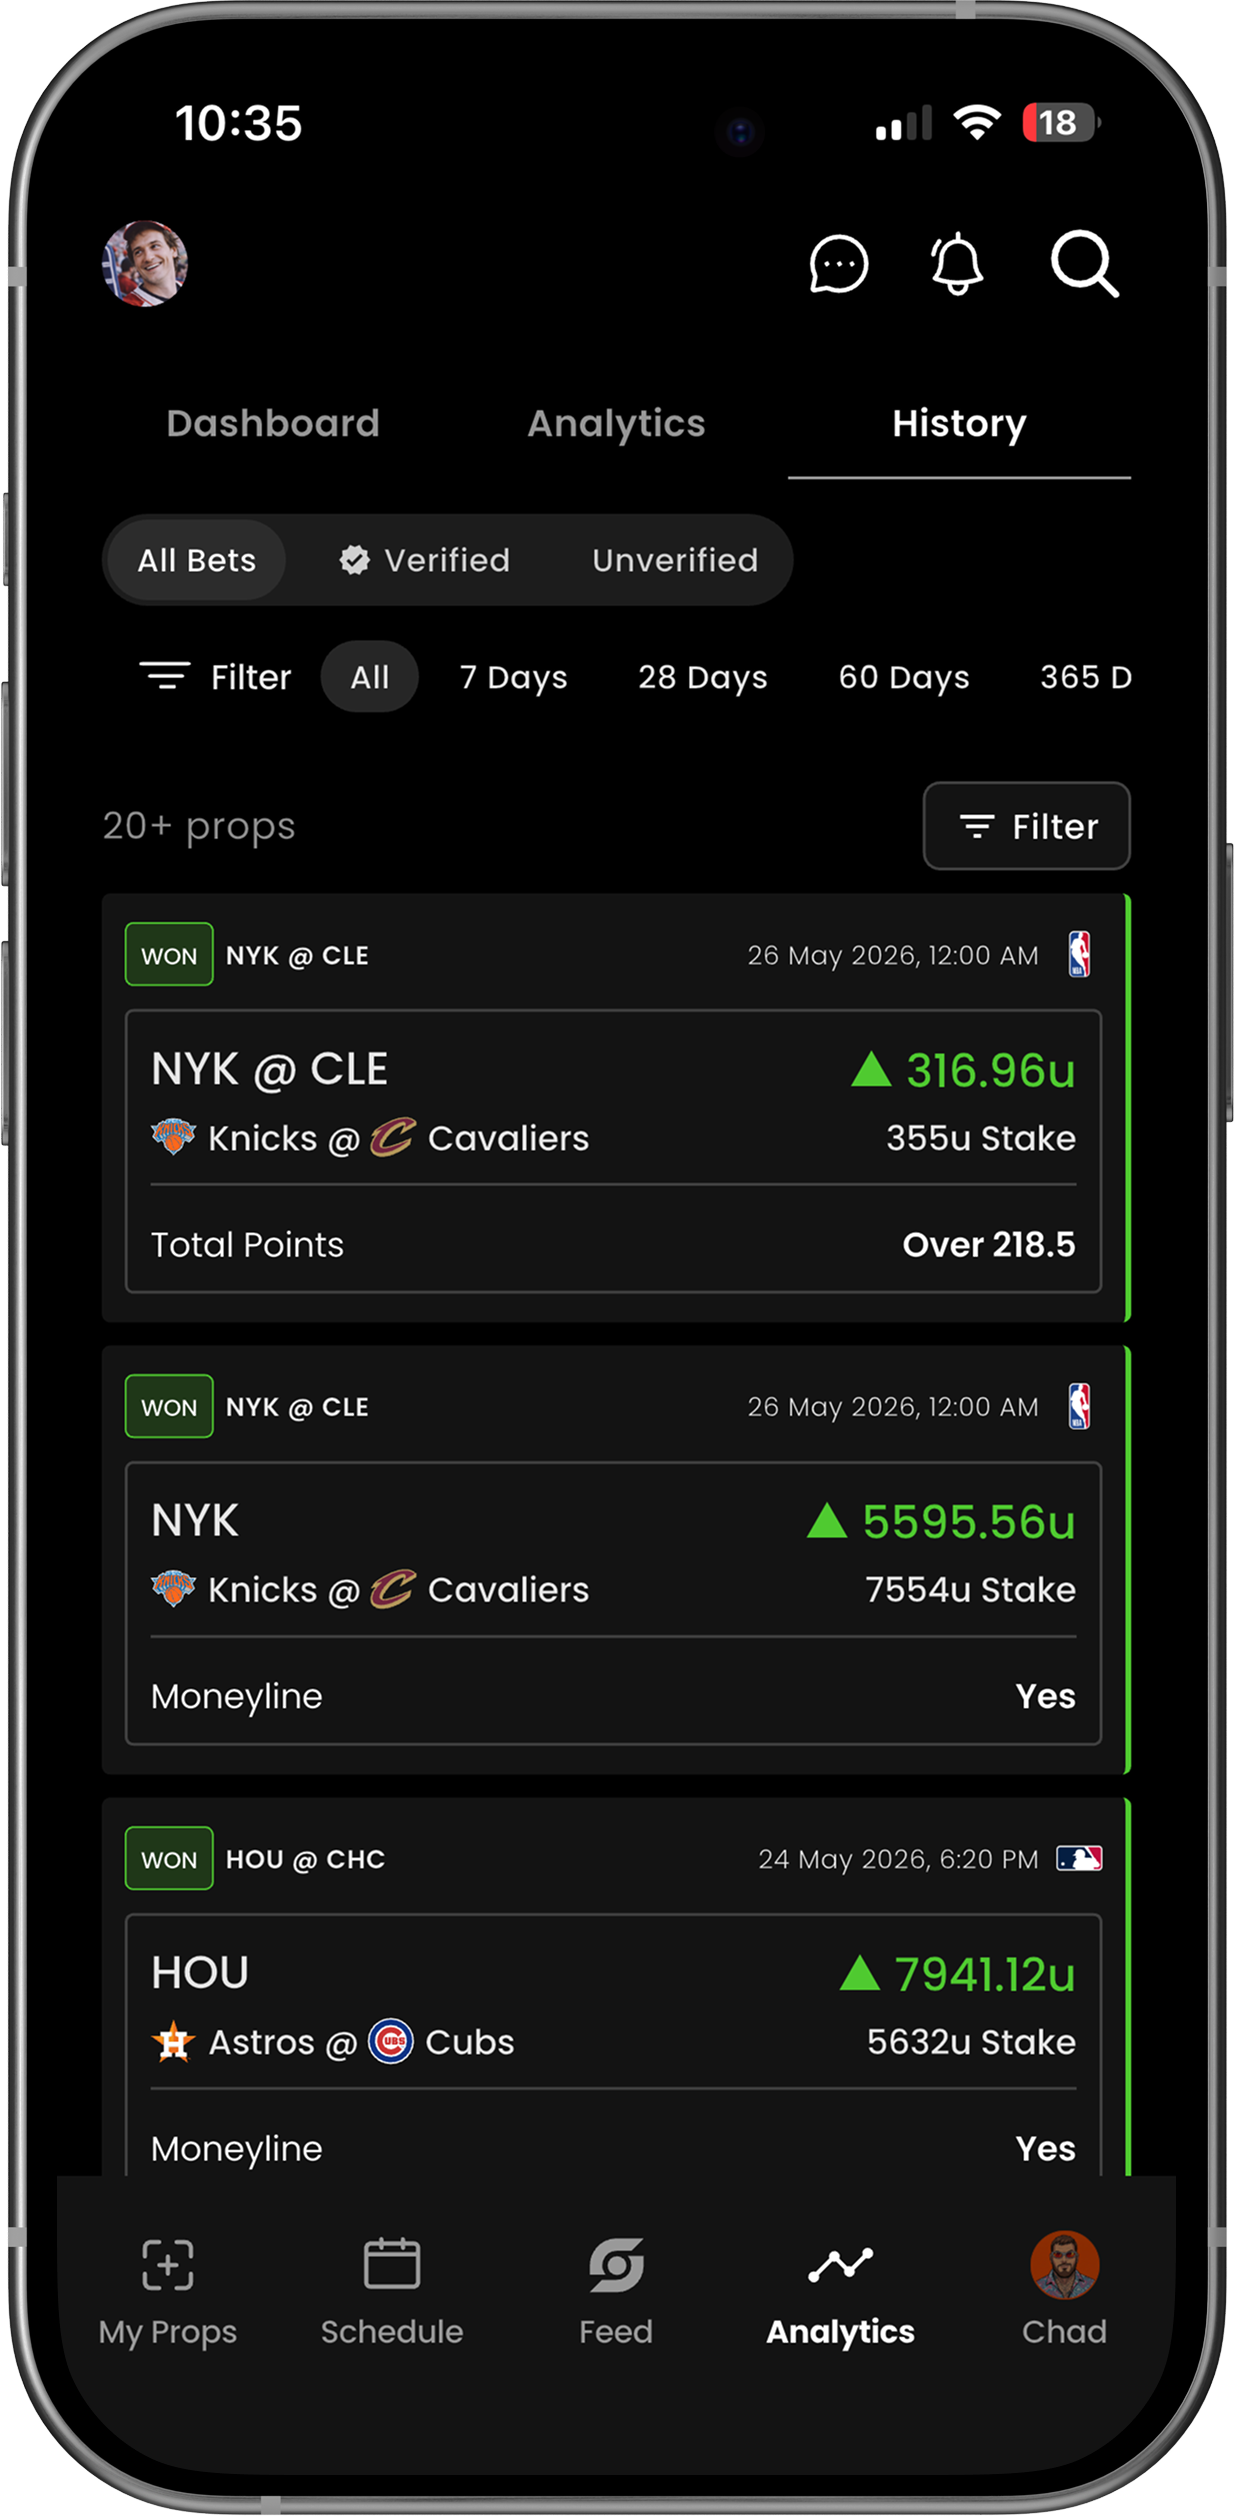
Свака оклада. Оцењена и на записнику.
Потпуни, филтрирајући лог твојих обрађених prop-ова. Сваки унос приказује меч, лигу, prop и линију, твој улог, исплату и резултат — аутоматски оцењено у тренутку кад утакмица заврши. 20+ prop-ова и број расте.
Филтрирај по резултату, спорту, опсегу датума
Верификоване окладе закључане након почетка
Додирни окладу за све детаље · победа/пораз у боји
Explore Stat Sniper
Go deeper
Пријавите се
за нашу мејлинг листу